In today's world where "energy" has become more important than ever as a vital resource, "Energy Automation Systems" have become the first step and starting point for taking energy under control and creating efficient operating and consumption conditions. Because efficiency is achieved through control, control starts with monitoring.
In general, the energy automation systems that our company is establishing, monitoring and controlling the status and malfunctions of transformers, generators, low voltage (LV) panels and switches in the facilities, monitoring and controlling medium voltage (MV) breakers and disconnectors, using energy analyzers or power converter devices. It provides monitoring of current, voltage, power, power factor, active reactive energy consumption, and monitoring and control of protection relays.
In addition, it is also among the tasks of energy automation systems to inform the operators of the alarm and malfunction situations in the system in real time, to organize the energy consumption of the system in reports and present them to the operators.
Today's business and energy managers have a powerful tool to minimize energy consumption, maximize comfort and achieve sustainable building operation.
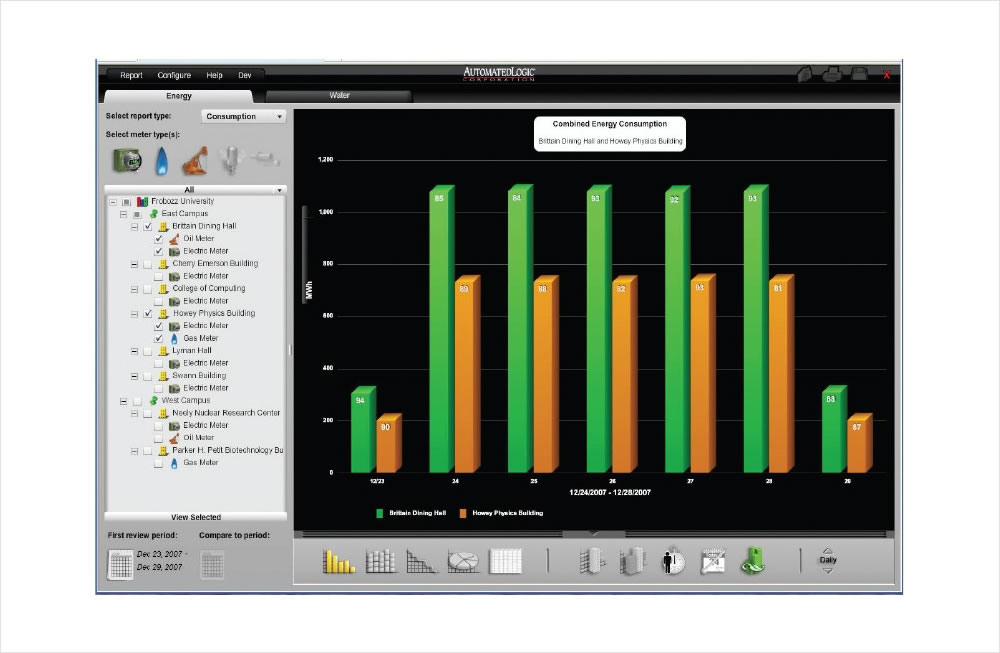
Autometed Logic's new Energy Reporting application is an incredibly flexible and easy-to-use reporting tool that uses WebCTRL's extensive trend-setting capabilities to measure energy consumption and our Environmental Indicator product for comfort measurement.
Key Features and benefits
- Animated energy consumption or requirement reports can be viewed as 3D bar, line and pie pie charts or data arranged in tabular form.
- Easy and convenient access using numerous internet browsers.
- Attractive and easy to understand user interface with a system tree view designed for ease of use.
- Energy consumption can be standardized by area or converted into other engineering units (e.g. CO2)
- It covers used / unused areas, Days Cooled (CDD) and Days Made Heating (HDD) low-average-high data and benchmark data for comparison.
- Environmental Indicator integrates into Energy Reports, enabling you to compare efficiency and comfort intelligently.
- Adobe Acrobat and Micrasoft Excel reports can be generated from both client and server archives.
- Java application is compatible with WebCTRL v4 or higher on multiple operating systems.
- Easy to install on existing WebCTRL server - no additional server or third party integration software required.
- Integrated Report Manager to schedule reports on a monthly, quarterly or annual basis.
Energy Reports is a JAVA application that works concurrently with WebCTRL, giving access to key environmental reports via Internet Explorer or Firefox browsers. All consumption and energy consumption data for electricity, natural gas, petroleum steam or chilled water are stored in an industrial standard database.Measurable energy sources can be easily configured and assigned to buildings or areas of use in the Energy Reports user tree. Designed for use in areas with single or multiple buildings, Energy Reports can be added directly to existing WebCTRL systems with minimal installation and are ideal for WebCTRL retrofit or new construction projects.
Energy reports allow users to compare their energy consumption or requirements in different periods with the drop-down menus or to select special periods by using the calendar control. Dynamic and animated three-dimensional color graphics can quickly turn into a bar, line, pie or chart.With a single mouse click, the user can standardize consumption data, convert cost into currency and carbon dioxide emissions, or change engineering units instantly. Energy consumption can be benchmarked and compared easily with verified data or with similar buildings in the same surrounding using a simple animated toolbar.Similarly, the energy consumption of used buildings can be visually distinguished from unused buildings. Days with Cooling and / or days of heating are calculated automatically and can be graphically displayed over the review period with a single mouse click.
Rising energy prices and growing environmental awareness have enabled everyone to focus on minimizing the energy consumption in buildings and maximizing their efficiency. Business managers are well aware that sacrificing human comfort is far more costly in terms of lost productivity and income. The Environmental Indicator provides a simple and effective solution for measuring comfort in a building or space, because energy efficiency must be balanced with comfort.
Energy Reports can show energy consumption by directly comparing energy efficiency with comfort with the Environmental Indicator. Providing sustainable building operation becomes much easier with Energy Reports.
In addition, to make operation much easier, Energy Reports has a Report manager (report manager) to schedule repetitive monthly, quarterly or annual reports and automatically send them to assigned personnel in Adobe PDF and / or Micrasoft Excel format by e-mail.
Application Information
- Requires JAVA API update and WebCTRL v4 or later with enterprise license.
- Energy reports Java applications run simultaneously with WebCTRL.
- Supported databases: MySQL 5.0, PostgreSQL 7.4, Oracle 10g or SQL Server 2005 or later.
- Supported browsers: Internet Explorer7.x or Firefox 3.05. Access with WebCTRL username / password.